J07481+4352
SDSSJ074811.33+435239.6 · Culpan knownhsd
χ²/N = 0.97
Spectrum
shaded: the intervals the fit used · │ a cancelled pixeldrag on either panel to zoom · dbl-click or Esc to reset · arrows to pan
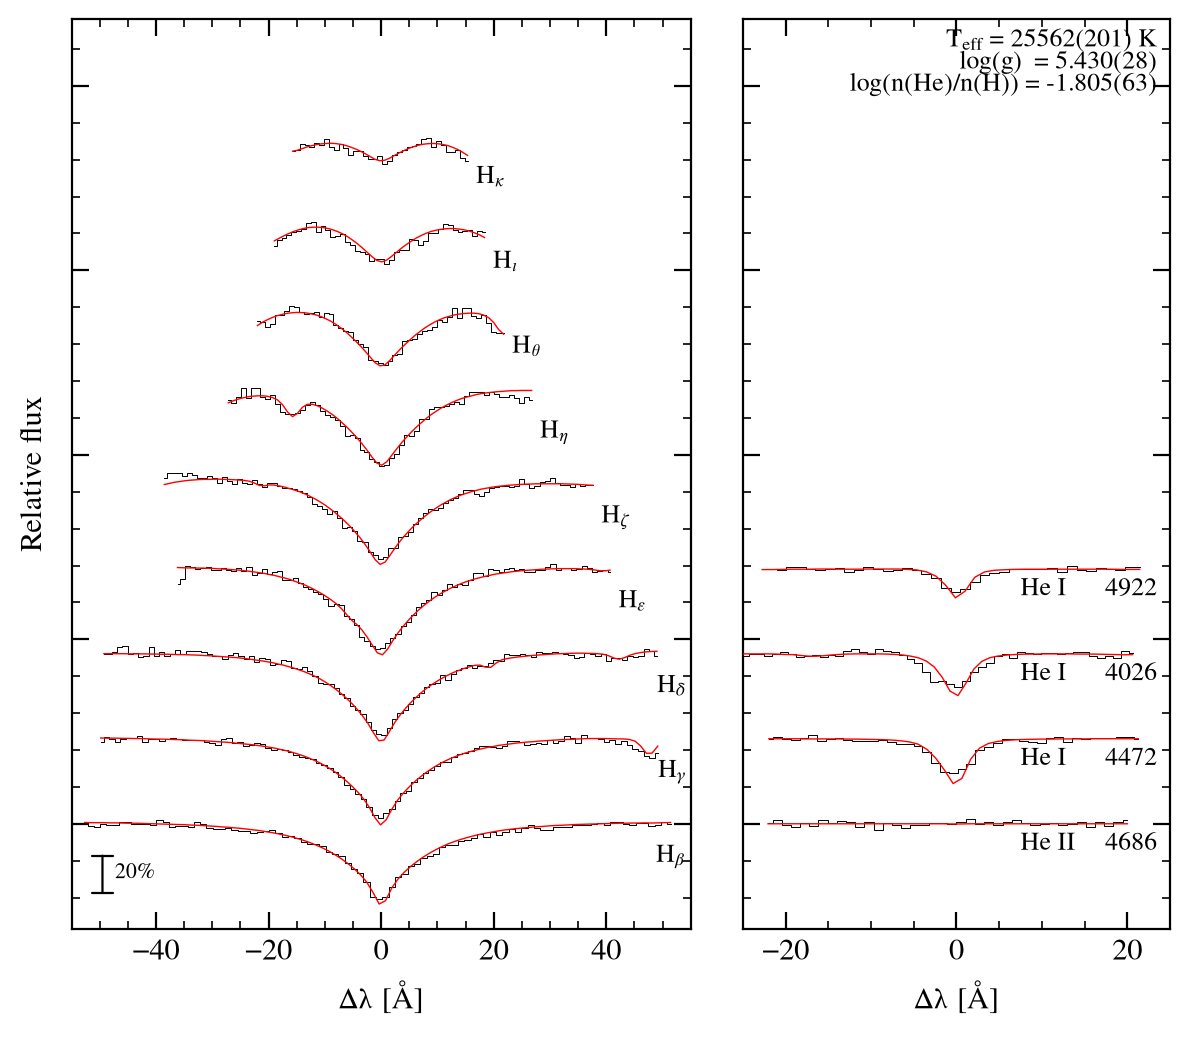
The whole reduced spectrum above, the region marked on it below. Shaded bands are the intervals the fit used; a tick under the axis marks a pixel the rejection mask cancelled.
Line-profile fit — Bamberg
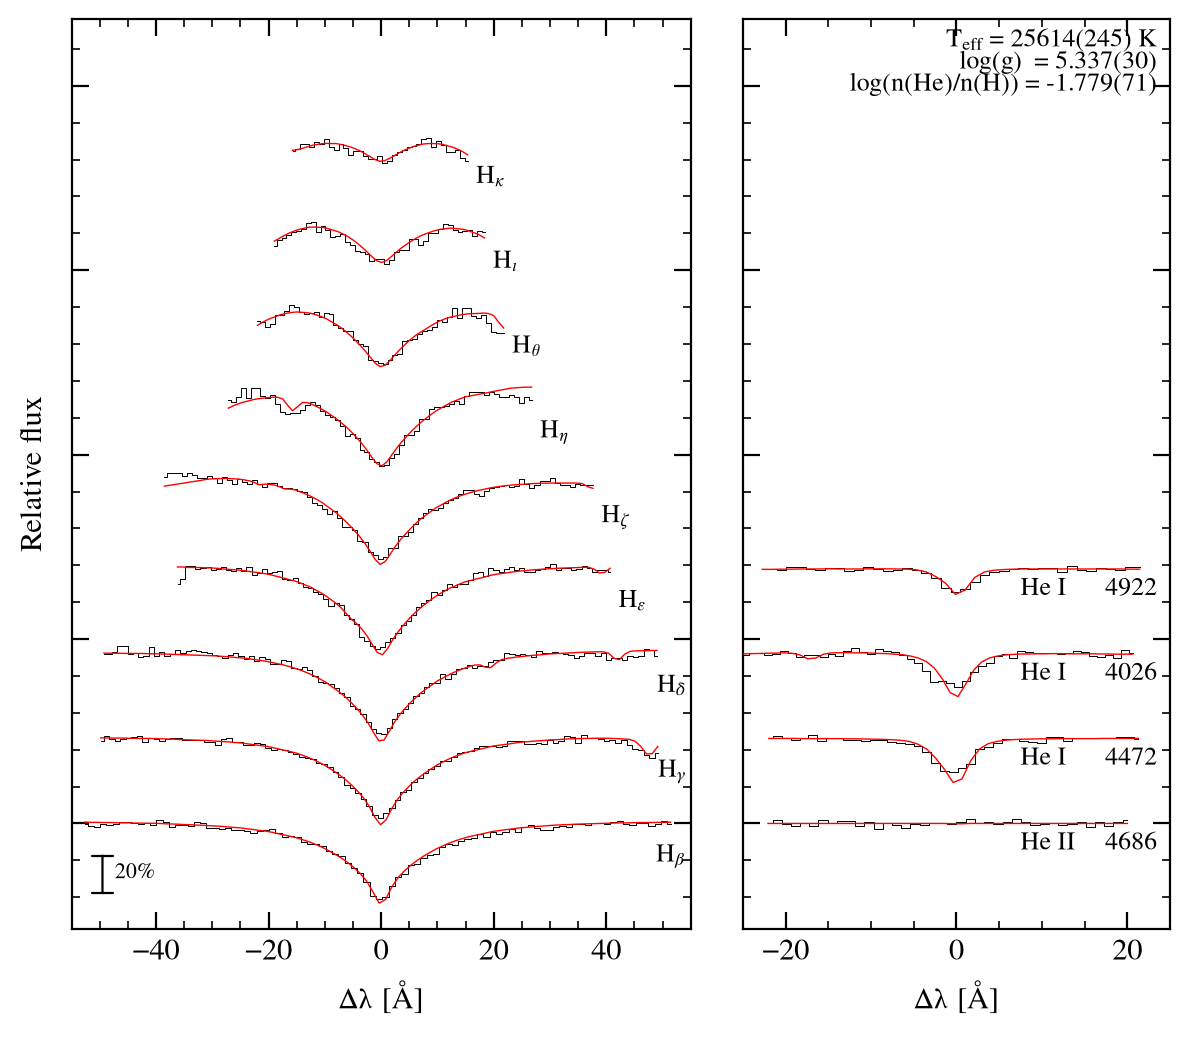
Line-profile fit — uli
Results and provenance
Fit — Bamberg
| Teff [K] | 25562 ± 201 |
| log g | 5.430 ± 0.028 |
| log n(He)/n(H) | -1.805 ± 0.063 |
| reduced χ² | 0.966 over 659 points |
| radial velocity | -121.0 km s−1 |
| resolution (FWHM) | 2.00 Å |
| lines fitted | 13 |
| grids | HE-0.041.fits HE-0.125.fits HE-0.300.fits HE-0.550.fits +9 more |
| fitted | 04/09/2026 19:07:40 |
Fit — uli
| Teff [K] | 25614 ± 245 |
| log g | 5.337 ± 0.030 |
| log n(He)/n(H) | -1.779 ± 0.071 |
| reduced χ² | 0.960 over 659 points |
| radial velocity | -121.0 km s−1 |
| resolution (FWHM) | 2.00 Å |
| lines fitted | 13 |
| grids | h909.grid h97.grid h99.grid h999.grid |
| fitted | 04/09/2026 18:34:50 |
Observation
| source file | spec-3676-55186-0436.fits |
Gaia astrometry
| Gaia DR3 source | 925982721247295488 |
| parallax [mas] | 0.3228 ± 0.0781 |
| G | 16.961 |
| μα [mas/yr] | 1.722 |
| μδ [mas/yr] | -14.309 |
| l, b | 175.428, 28.248 |
Published (Culpan et al. 2022)
| class (Culpan) | sdB |
| class (SIMBAD) | sdB |
| Teff [K] | 26083 ± 851 |
| log g | 5.49 ± 0.11 |
| log y | -1.92 ± 0.19 |
| reference | 2019MNRAS.486.2169K |
Fitted lines
| line | λ [Å] | shift [Å] | continuum at | ±avg | fitted over |
| Hβ | 4861.32 | -1.96 | -40.0, 40.0 | 5.0 | -45.0, 45.0 |
| Hγ | 4340.46 | -1.75 | -40.0, 36.8 | 4.5 | -43.0, 43.0 |
| Hδ | 4101.73 | -1.66 | -40.0, 31.6 | 4.2 | -43.0, 43.0 |
| Hε | 3970.07 | -1.60 | -28.0, 30.0 | 4.1 | -30.0, 35.0 |
| Hζ | 3889.05 | -1.57 | -20.0, 26.2 | 4.0 | -31.8, 32.0 |
| Hη | 3835.38 | -1.55 | -20.0, 14.6 | 4.0 | -20.7, 21.8 |
| Hθ | 3797.90 | -1.53 | -16.0, 16.0 | 3.9 | -15.6, 16.7 |
| Hι | 3770.63 | -1.52 | -13.0, 13.0 | 3.9 | -11.7, 11.6 |
| Hκ | 3750.15 | -1.51 | -10.0, 10.0 | 3.9 | -7.4, 8.7 |
| He II 4686 | 4685.70 | -1.89 | -11.9, 11.9 | 4.9 | -15.0, 13.8 |
| He I 4472 | 4471.60 | -1.80 | -15.0, 15.0 | 4.6 | -15.0, 15.0 |
| He I 4026 | 4026.29 | -1.63 | -24.2, 15.0 | 4.2 | -15.0, 15.0 |
| He I 4922 | 4921.93 | -1.99 | -15.0, 15.0 | 5.1 | -15.0, 15.0 |
Spectral energy distribution
Teff 25562 K · log g 5.430 · E(44−55) 0.100 · χ²r 0.18 over 30 bands
distance 3098 pc · parallax 0.3200 ± 0.0800 mas (25%) · R 0.2103 +0.0676 −0.0408 R☉ · M 0.434 +0.336 −0.157 M☉ · L 17.0 +12.7 −6.0 L☉
Photometry against the model, with the residual beneath it in units of the error. The horizontal bar on each point is the passband, not an error; a hollow point was not fitted and the tooltip says why. Drag a box to zoom, double-click or Esc to come back out.