J09510+0347
PG0948+041 · Culpan knownhsd
χ²/N = 0.98
Spectrum
The whole reduced spectrum above, the region marked on it below. Shaded bands are the intervals the fit used; a tick under the axis marks a pixel the rejection mask cancelled.
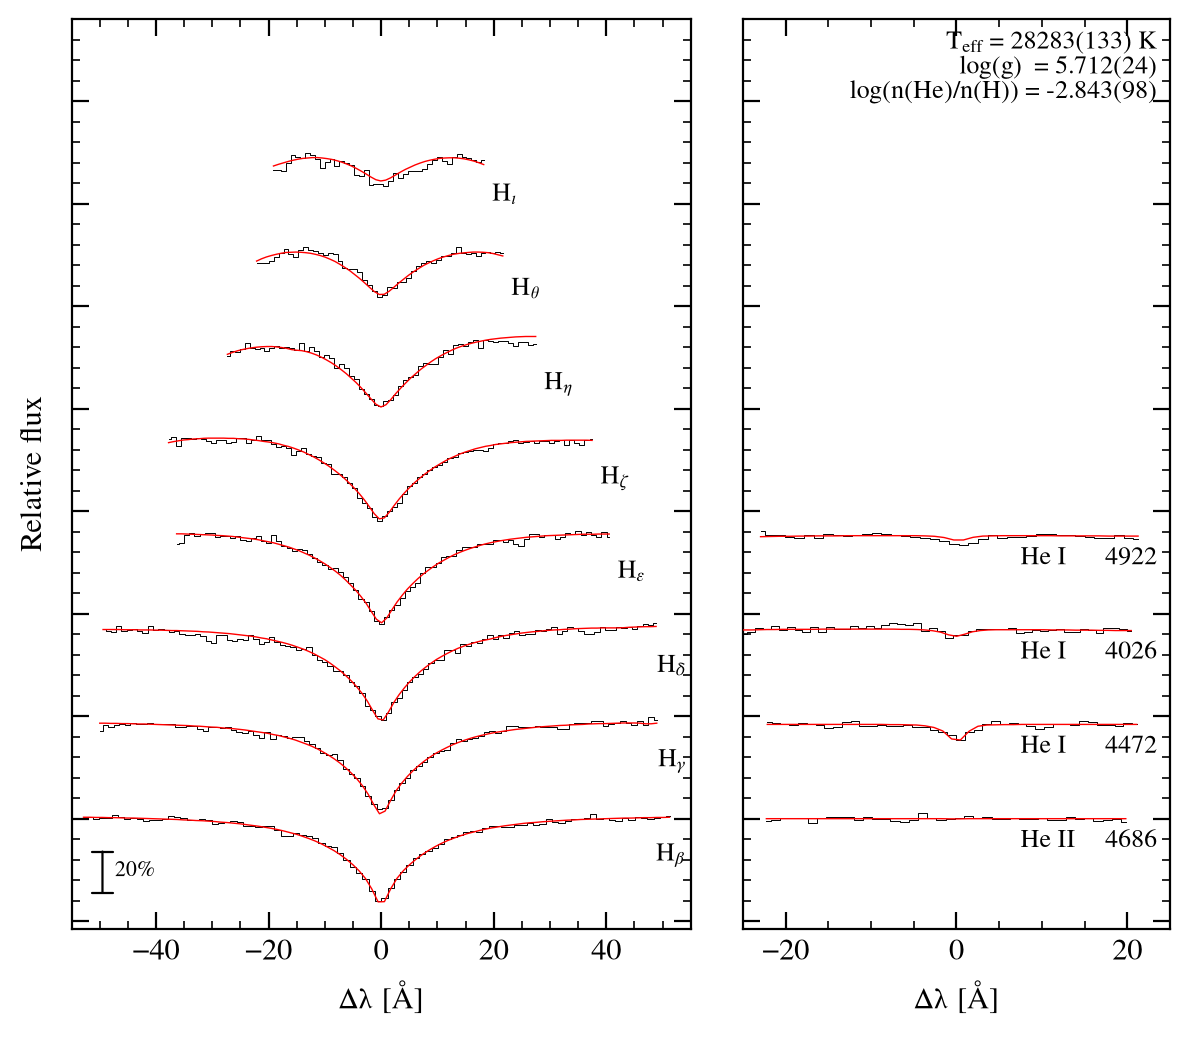
Line-profile fit — Bamberg
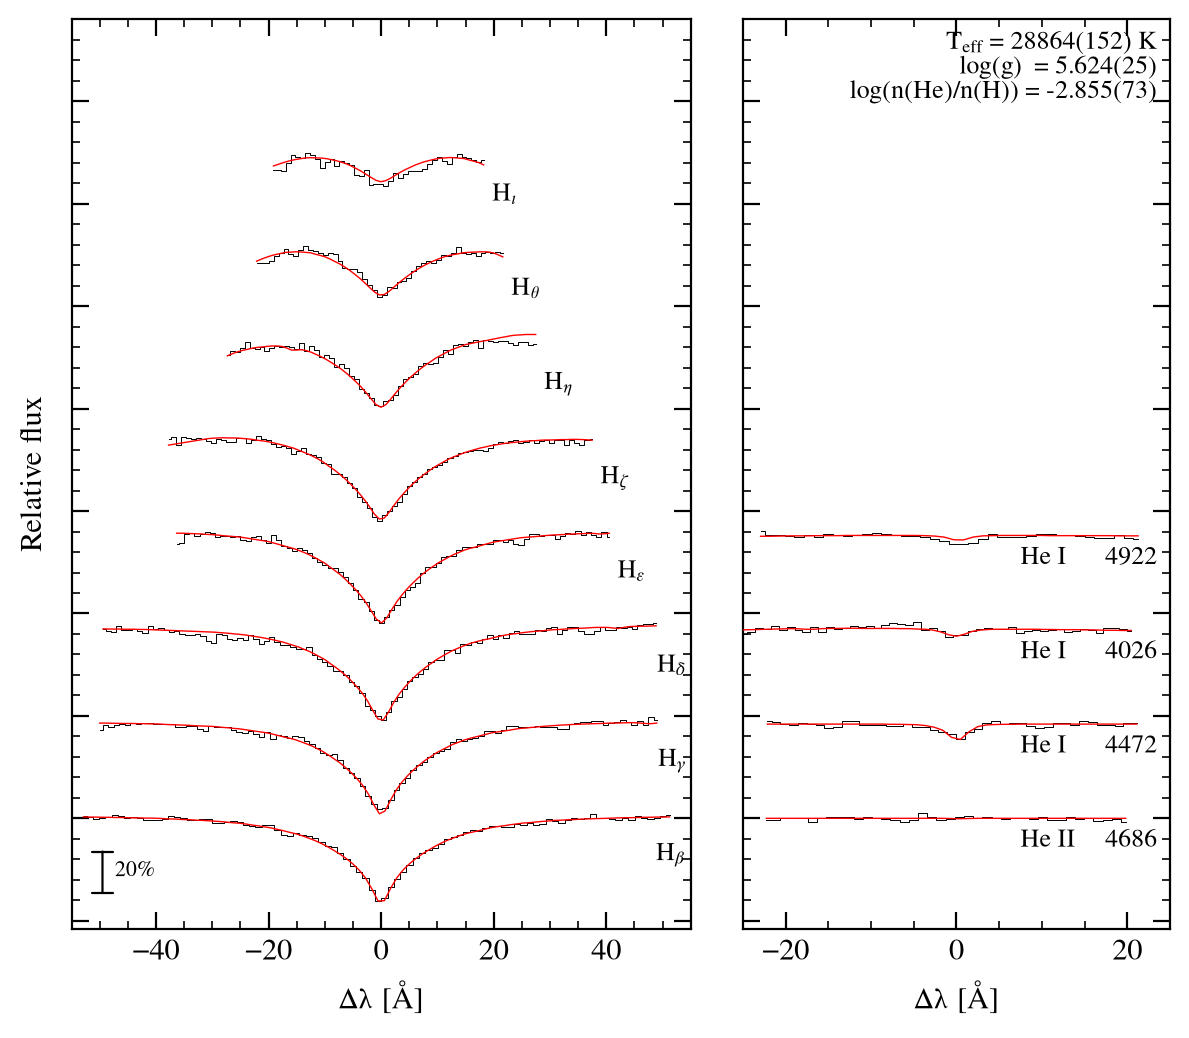
Line-profile fit — uli
Results and provenance
Fit — Bamberg
| Teff [K] | 28283 ± 133 |
| log g | 5.712 ± 0.024 |
| log n(He)/n(H) | -2.843 ± 0.098 |
| reduced χ² | 0.984 over 639 points |
| radial velocity | -133.0 km s−1 |
| resolution (FWHM) | 2.00 Å |
| lines fitted | 12 |
| grids | HE-0.041.fits HE-0.125.fits HE-0.300.fits HE-0.550.fits +9 more |
| fitted | 04/09/2026 19:08:13 |
Fit — uli
| Teff [K] | 28864 ± 152 |
| log g | 5.624 ± 0.025 |
| log n(He)/n(H) | -2.855 ± 0.073 |
| reduced χ² | 0.986 over 639 points |
| radial velocity | -133.0 km s−1 |
| resolution (FWHM) | 2.00 Å |
| lines fitted | 12 |
| grids | h667.grid h909.grid h97.grid h99.grid +1 more |
| fitted | 04/09/2026 18:35:14 |
Observation
| source file | spec-4743-55645-0784.fits |
Gaia astrometry
| Gaia DR3 source | 3849462024992532608 |
| parallax [mas] | 0.4480 ± 0.0536 |
| G | 15.867 |
| Gabs | 4.256 |
| μα [mas/yr] | -11.590 |
| μδ [mas/yr] | -8.009 |
| l, b | 233.282, 41.072 |
Published (Culpan et al. 2022)
| class (Culpan) | sdB+WD |
| class (SIMBAD) | sdOB |
| Teff [K] | 29800 ± 300 |
| log g | 5.48 ± 0.04 |
| log y | -2.80 ± 0.30 |
| reference | 2015A&A...577A..26G |
Fitted lines
| line | λ [Å] | shift [Å] | continuum at | ±avg | fitted over |
| Hβ | 4861.32 | -2.16 | -40.0, 40.0 | 5.0 | -45.0, 45.0 |
| Hγ | 4340.46 | -1.93 | -40.0, 36.8 | 4.5 | -43.0, 43.0 |
| Hδ | 4101.73 | -1.82 | -40.0, 31.6 | 4.2 | -43.0, 43.0 |
| Hε | 3970.07 | -1.76 | -28.0, 30.0 | 4.1 | -30.0, 35.0 |
| Hζ | 3889.05 | -1.73 | -20.0, 26.2 | 4.0 | -31.8, 32.0 |
| Hη | 3835.38 | -1.70 | -20.0, 14.6 | 4.0 | -20.7, 21.8 |
| Hθ | 3797.90 | -1.68 | -16.0, 16.0 | 3.9 | -15.6, 16.7 |
| Hι | 3770.63 | -1.67 | -13.0, 13.0 | 3.9 | -11.7, 11.6 |
| He II 4686 | 4685.70 | -2.08 | -11.9, 11.9 | 4.9 | -15.0, 13.8 |
| He I 4472 | 4471.60 | -1.98 | -15.0, 15.0 | 4.6 | -15.0, 15.0 |
| He I 4026 | 4026.29 | -1.79 | -24.2, 15.0 | 4.2 | -15.0, 15.0 |
| He I 4922 | 4921.93 | -2.18 | -15.0, 15.0 | 5.1 | -15.0, 15.0 |
The composite, taken apart
This star is two stars. The subdwarf's lines sit in a continuum that is mostly the companion's, so a fit that models the spectrum as one star measures neither — it finds whatever gravity makes a single set of Balmer lines as shallow as the diluted ones look. What is fitted here instead is Irrgang et al. (2014) Eq. 1: the two normalised models are weighted by their own continua, f = (1−x)fp + x fs with x(λ) = qCs/(Cp+qCs) and q = (R2/R1)². The companion — 5000 K, q = 8 — comes from the SED, not from this spectrum; what the spectrum is asked for is the subdwarf, with that dilution imposed. It runs from 1 per cent of the light at 3729 Å to 6 per cent at 4966 Å, which is the reason a single veiling factor will not do.
| Teff [K] | log g | log n(He)/n(H) | χ²r | what it is | |
|---|---|---|---|---|---|
| the fit here | 28098 ± 133 | 5.748 ± 0.025 | -2.81 ± 0.10 | 0.98 | companion in the model, converged |
| the same spectrum, one star | 28283 | 5.712 | -2.84 | 0.98 | what the sample table quotes |
| held for the SED | 28283 | 5.712 | — | — | so the companion's T and radius below rest on it |
On a flux scale
Unlike a NOT/ALFOSC spectrum, this one needs no measured instrument response: the SDSS/BOSS pipeline delivers it already flux-calibrated, so the panel below compares the spectrum's own physical flux directly against the two model components, with one free number — the angular-size scale — fitted to match. The residual strip runs -2% at the blue end to 7% at the red (rms 8.3% overall): a real trend across ~7000 Å of coverage, not just noise, and worth reading before trusting the absolute level at either end.
observed · sdB + companion · the sdB alone · the companion alone · ● Gaia XP. Drag to zoom, double-click to reset.
Every window, each divided by its own continuum so the two components' relative depths are preserved: the sdB alone · the companion alone · the sum in black where that line drove the fit, grey where it is shown for the eye only. Click one to enlarge it. The shaded span is the interval the fit weighed; red ticks are masked pixels.
Spectral energy distribution
Component 1, the subdwarf: Teff 28283 K (held) · log g 5.712 (held) · R 0.1976 R☉ (fitted, with the companion) · χ²r 0.72 over 39 bands
E(44−55) 0.034 (held)
Component 2, the companion: Teff 5000 K (fitted, 3500–8750 K grid) · log g 4.50 (held) · R 0.5751 R☉ (fitted) · χ²r 0.42 for the two components together (Δχ² 342 over one star, same bands)
The dashed curves beneath the model are the two components of this fit: the subdwarf alone and the cool companion.
distance 2232 pc · parallax 0.4500 ± 0.0500 mas (11%) · M 1.108 +0.363 −0.251 M☉ — above the 0.47 canonical mass · (from the ONE-star scale -- not corrected for the companion's light) · L 34.0 +10.0 −7.0 L☉
Photometry against the model, with the residual beneath it in units of the error. The horizontal bar on each point is the passband, not an error; a hollow point was not fitted and the tooltip says why. Drag a box to zoom, double-click or Esc to come back out.