J16557+1301
PG1653+131 · Culpan knownhsd
χ²/N = 0.99
Spectrum
shaded: the intervals the fit used · │ a cancelled pixeldrag on either panel to zoom · dbl-click or Esc to reset · arrows to pan
The whole reduced spectrum above, the region marked on it below. Shaded bands are the intervals the fit used; a tick under the axis marks a pixel the rejection mask cancelled.
Line-profile fit — Bamberg
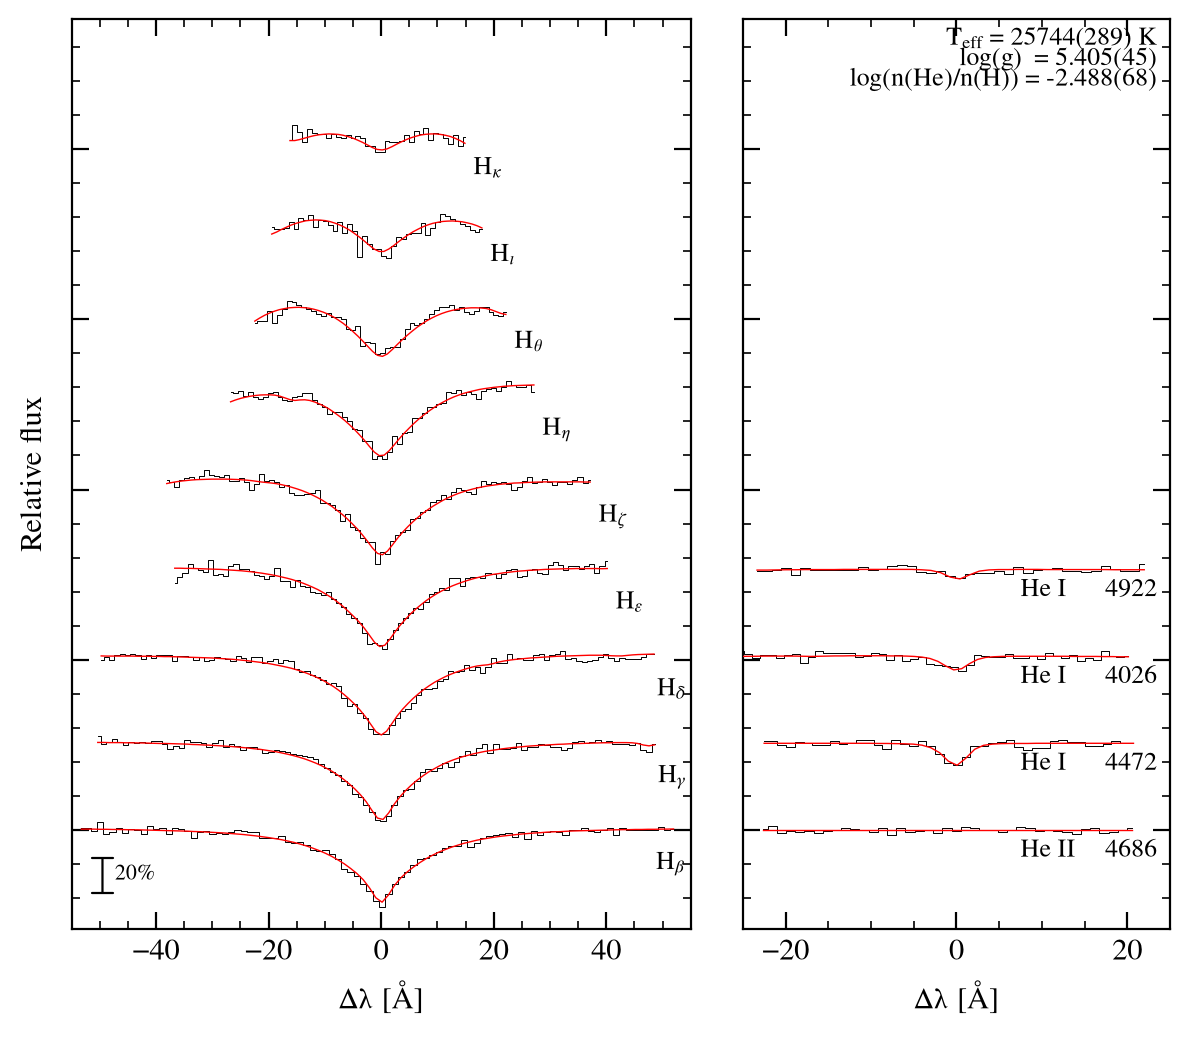
Results and provenance
Fit — Bamberg
| Teff [K] | 25744 ± 289 |
| log g | 5.405 ± 0.045 |
| log n(He)/n(H) | -2.488 ± 0.068 |
| reduced χ² | 0.993 over 659 points |
| radial velocity | -89.0 km s−1 |
| resolution (FWHM) | 2.50 Å |
| lines fitted | 13 |
| grids | HE-0.041.fits HE-0.125.fits HE-0.300.fits HE-0.550.fits +9 more |
| fitted | 04/09/2026 18:32:20 |
Fit — Lei (TLUSTY)
| Teff [K] | 26230 ± 550 |
| log g | 5.340 ± 0.060 |
| log n(He)/n(H) | -2.500 ± 0.100 |
| grids | Lei et al. 2018, ApJ 868, 70 SYNSPEC 49 spectra from NLTE TLUSTY 204 model atmospheres, through XTgrid |
Observation
| source file | spec-56395-HD165204N145827M01_sp07-163.fits.gz |
Gaia astrometry
| Gaia DR3 source | 4449162845336419840 |
| parallax [mas] | 0.9366 ± 0.0347 |
| G | 14.357 |
| Gabs | 4.255 |
| μα [mas/yr] | -1.083 |
| μδ [mas/yr] | -12.424 |
| l, b | 31.975, 31.484 |
Published (Culpan et al. 2022)
| class (Culpan) | sdB |
| class (SIMBAD) | sdB |
| Teff [K] | 25600 ± 900 |
| log g | 5.40 ± 0.10 |
| log y | -2.70 ± 0.10 |
| reference | 2001MNRAS.326.1391M |
Fitted lines
| line | λ [Å] | shift [Å] | continuum at | ±avg | fitted over |
| Hβ | 4861.32 | -1.44 | -40.0, 40.0 | 5.0 | -45.0, 45.0 |
| Hγ | 4340.46 | -1.29 | -40.0, 36.8 | 4.5 | -43.0, 43.0 |
| Hδ | 4101.73 | -1.22 | -40.0, 31.6 | 4.2 | -43.0, 43.0 |
| Hε | 3970.07 | -1.18 | -28.0, 30.0 | 4.1 | -30.0, 35.0 |
| Hζ | 3889.05 | -1.15 | -20.0, 26.2 | 4.0 | -31.8, 32.0 |
| Hη | 3835.38 | -1.14 | -20.0, 14.6 | 4.0 | -20.7, 21.8 |
| Hθ | 3797.90 | -1.13 | -16.0, 16.0 | 3.9 | -15.6, 16.7 |
| Hι | 3770.63 | -1.12 | -13.0, 13.0 | 3.9 | -11.7, 11.6 |
| Hκ | 3750.15 | -1.11 | -10.0, 10.0 | 3.9 | -7.4, 8.7 |
| He II 4686 | 4685.70 | -1.39 | -11.9, 11.9 | 4.9 | -15.0, 13.8 |
| He I 4472 | 4471.60 | -1.33 | -15.0, 15.0 | 4.6 | -15.0, 15.0 |
| He I 4026 | 4026.29 | -1.20 | -24.2, 15.0 | 4.2 | -15.0, 15.0 |
| He I 4922 | 4921.93 | -1.46 | -15.0, 15.0 | 5.1 | -15.0, 15.0 |